
RELATIVE POVERTY: COMPARING CHALK AND CHEESE?
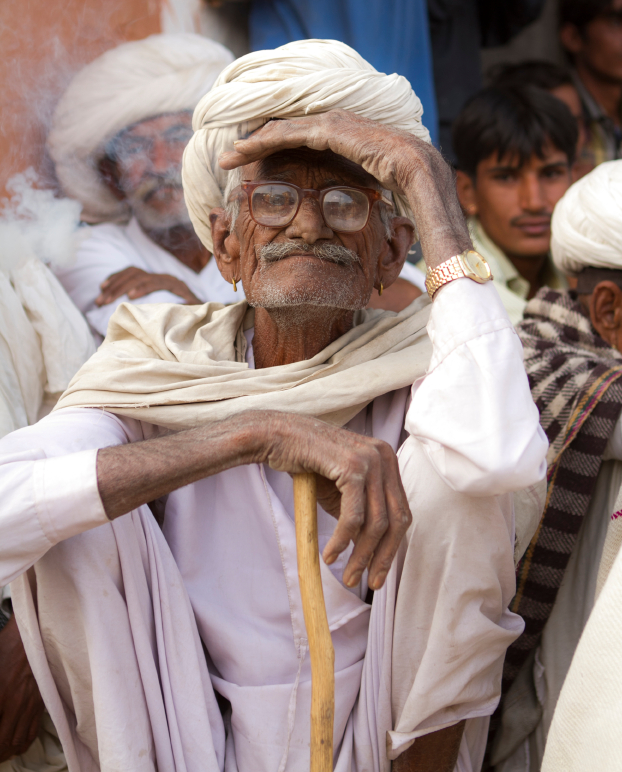
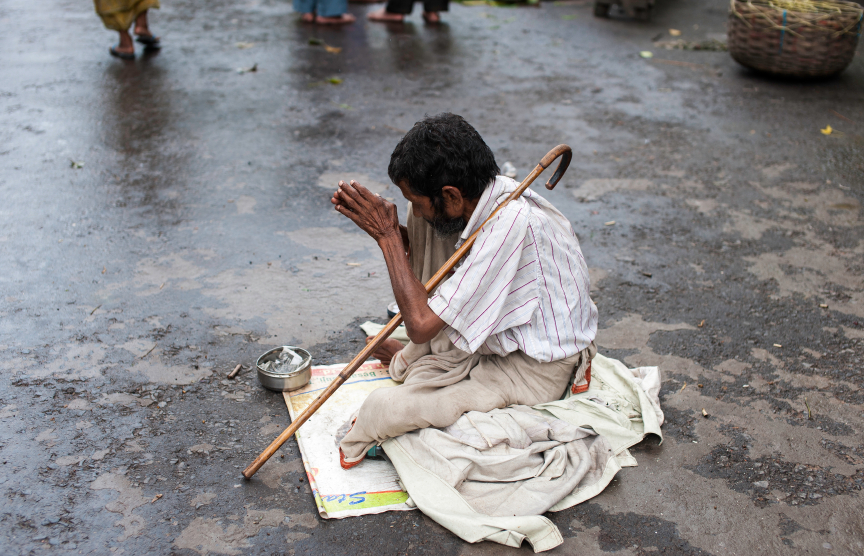
There are over 7 billion people on the planet. Some 1.75 billion of those are ‘living in poverty’ according to recent UN figures. And every one of them is different. How then can you consider the idea of relative poverty? Isn’t comparing one person’s poverty to another just like comparing “chalk and cheese”?
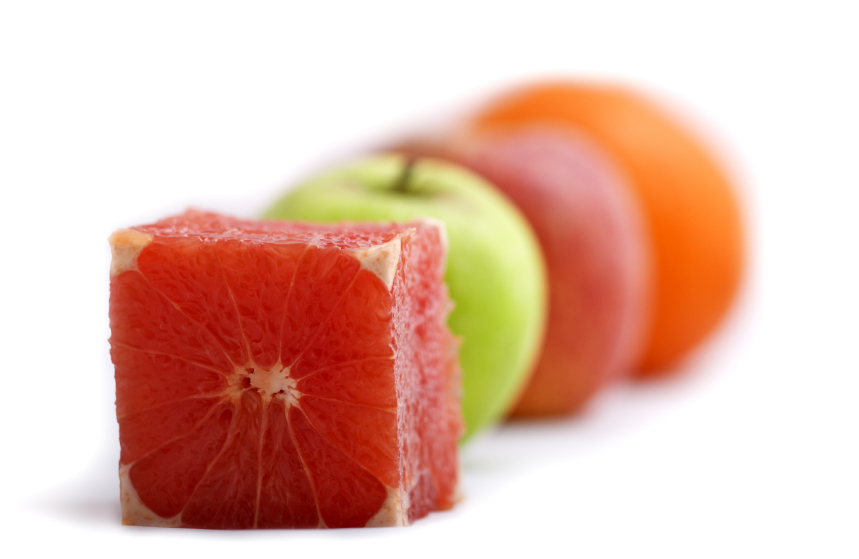
Well yes. If by ‘comparing chalk and cheese’, you mean comparing two things that initially seem to be very different, yet can still be compared in rather useful ways! Let us explain.
On the one hand, chalk and cheese are VERY different. Chalk is a mineral. It tastes disgusting. Cheese is a type of food. It tastes…well yes, some people might say some cheeses taste disgusting too, but that is not the point. The point about such comparisons is, that things can seem similar, OR different – it depends on WHICH ATTRIBUTES of those things you are comparing and which you are contrasting.
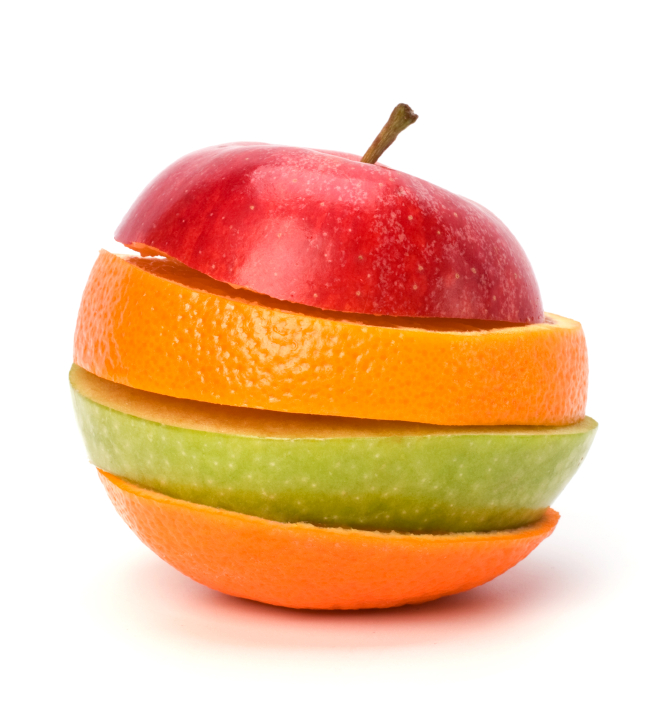
Don’t agree? Well, let’s consider chalk and cheese specifically then. They’re different, right? Except…that they are both nouns. They both begin with the letters ‘ch’. They both exist in the real world. They both contain things that are beneficial to human health. We could go on.

It is the same with relative poverty. When you try to compare 1.75 billion people to each other, they may seem different, or they may seem similar – it all depends on WHAT you are comparing at the time and HOW you decide to measure it. From the UN figures, the guidance is that anyone living on the equivalent of under US$2 per day is living ‘beneath the poverty line’. Anyone living on less than the equivalent of US$1.25 per day is considered to be in ‘extreme’ poverty.
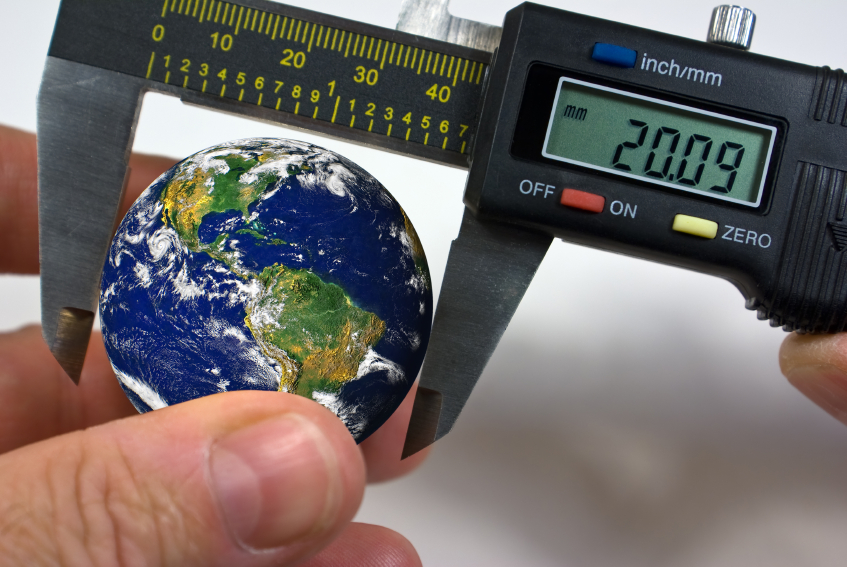
The average GDP per capita figures used here are the single attribute (suitably adjusted for inflation and purchasing power) that is being compared, in order to arrive at such comparisons and distinctions. If we were to subscribe to the idea of absolute poverty, GDP/capita is a fairly absolute measure. It has the appeal of being reasonably easy to calculate for large populations and across the world, through the last 200 years of history. It can also be compared between billions of people. That’s useful. At least, up to a point.
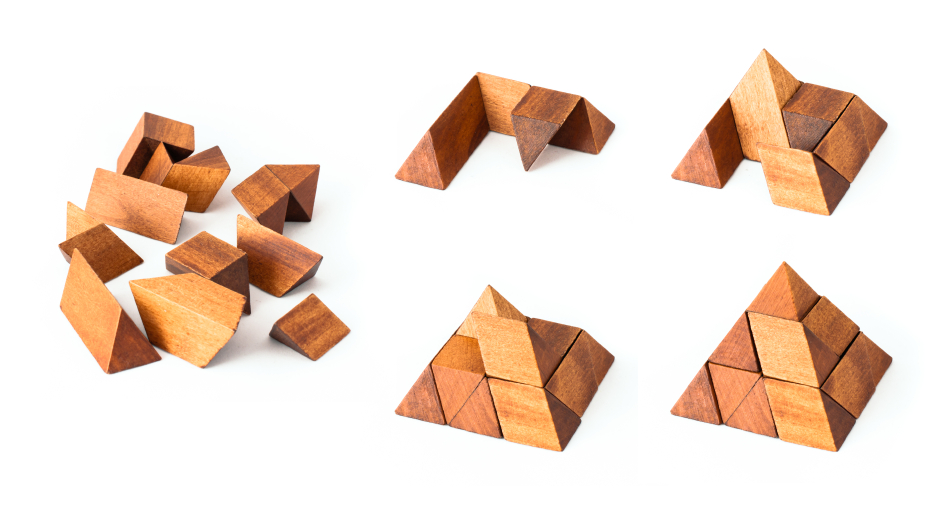
So we have come up with something else that’s useful too. It’s called the 7 Layer Poverty Model and it enables you to take some of the thinking and insights of relative poverty and apply them in absolute terms – enabling you to compare one person’s experience of poverty with another – and with a reasonable degree of consistency.
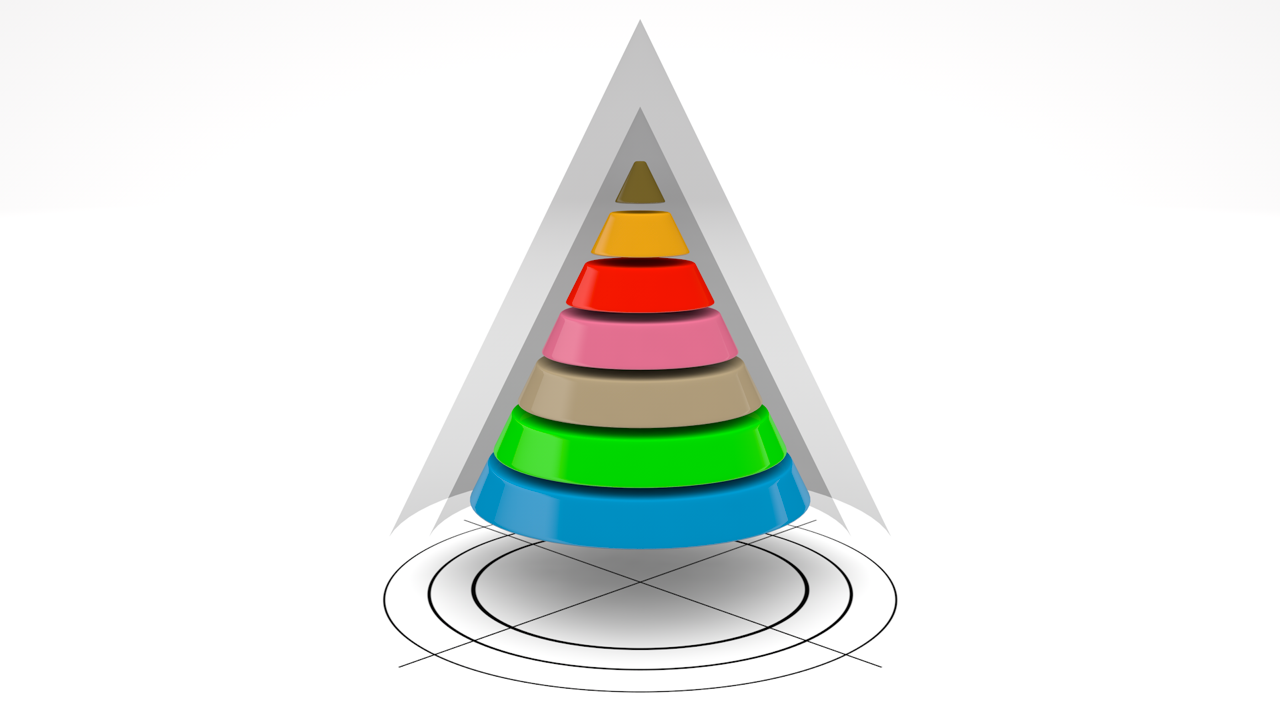
What the model does, is the equivalent of defining what are the specific attributes of ‘chalk’ and ‘cheese’ that we are going to compare, when it comes to assessing an individual’s experience of poverty. It achieves this by first taking a very specific definition of poverty – one that we can then work with effectively. Don’t panic. It is not wildly different from dictionary-type definitions, or the prevailing thinking of thought-leaders on poverty the world over. It is just more explicit – because it needs to be, if we are to use it the way we want to. It needs to be, if we are to understand relative poverty in absolute terms. You might call them: ‘relatively absolute terms’.
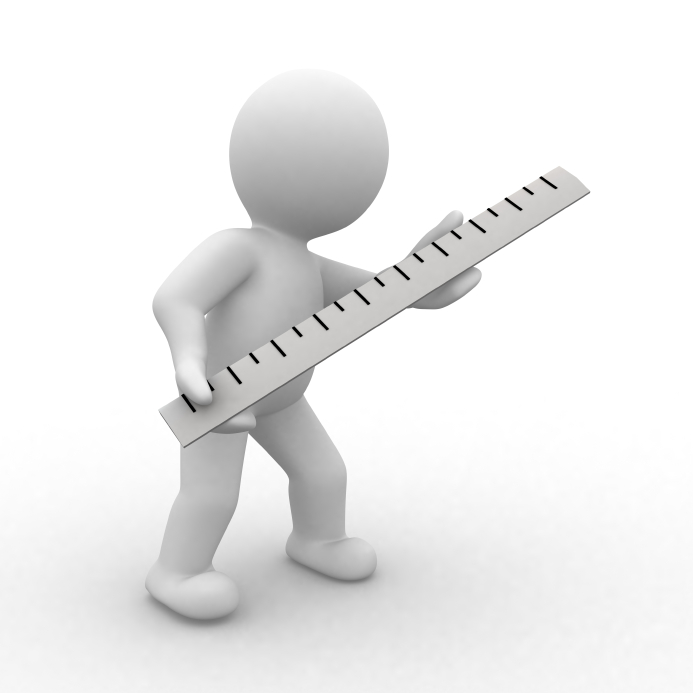
Our familiar illustration of this is human height. You cannot explicitly define what “tall” is globally. But we can ALL measure “tallness” in absolute terms – with a tape measure, for example. we call that measure “height”.

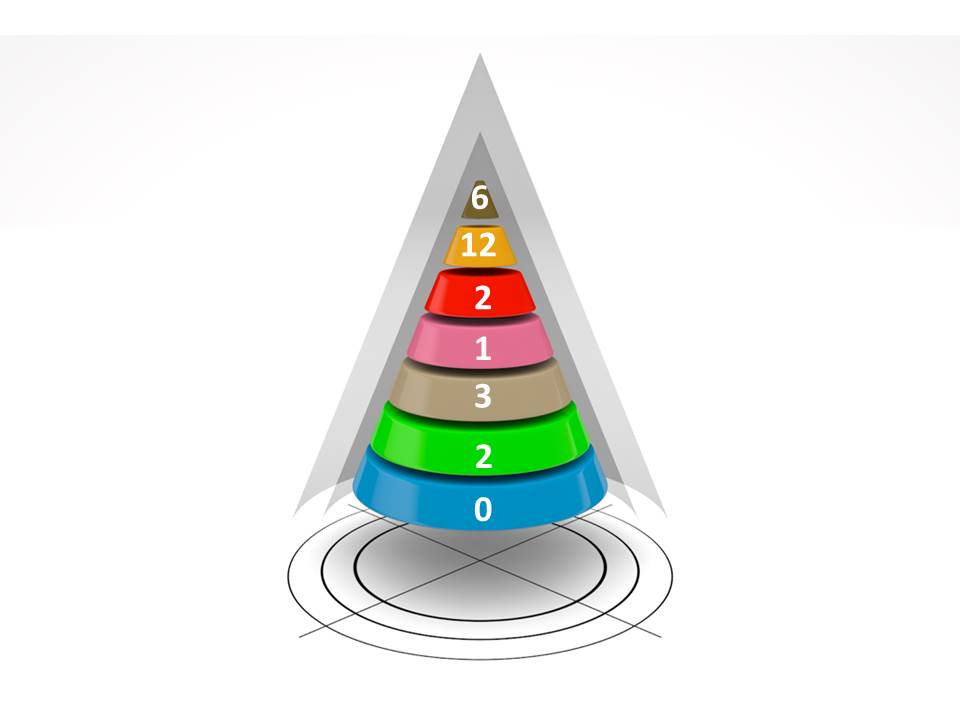
The Poverty Model just uses a different form of tape measure for the 7 layers of the model. It also uses some common concepts, between each layer, for which we are doing the measuring. Some of those layers are easier to use our ‘measure’ on than others. We understand that. For us, this is like comparing the ease of measuring a person’s height, to the difficulty of measuring their ‘waist‘. For some people, their ‘waist’ can be pretty hard to find, let alone measure! However, in such complicated cases, we do NOT give up and say that it is “impossible” to measure. Instead, we say that it is “possible to measure, but with some difficulty“. This positive attitude enables us to move forwards with our Assessments and still make useful comparisons between them.
Once we are all agreed on the definition of poverty, on the 7 Humanitarian Basics which form the layers of the Poverty Model, on the key aspects that we are measuring for each layer (attributes, access and availability), on the measuring method (Simple or Detailed Assessment) and on the planned Scope of any given Study – then we can begin.
To some, it may seem as bizarre as trying to compare chalk and cheese. To others it may seem an endeavour doomed to failure from the outset. But NOT to us. We think it just LOOKS too difficult to do until you break it down into sensible pieces. If you are one of those who thinks that the whole task seems too difficult to take on, then please don’t stand in the way of those of us who intend to get it done anyway.
We have the Model and the Method. All we need now is the volunteers. There are over 2 billion people out there already with internet access. We intend to engage at least a billion of them. An Assessment isn’t so hard to do, after all. Go ahead and try our online version of the 21 questions for yourself. You will find a link to our Global Poverty Survey from the main Menu. Create your OWN Poverty Profile, using the Simple Assessment. Multiply the three resulting factor numbers you get in each layer and that’s it. You will have the 7 numbers you need to create your own Simple Poverty Profile, from Water through to Freedom From Oppression.
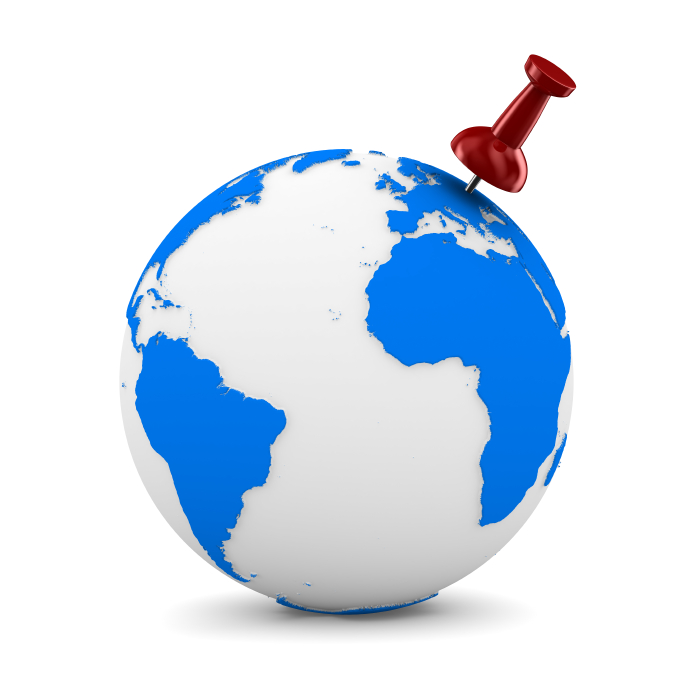
For now, you can compare those scores with others who are interested and might like to take the Assessment too. More usefully, you may be aware of just the right kind of Study project, where you could produce Poverty Profiles of an entire group, or an indicative Sample of Profiles from within a much larger group. That is for you to decide. We have put the Model and the Assessment method out there for you to use – and adapt as you see fit. In the future, we hope to be able to provide a common online platform for you all to upload and share your Poverty Profile Studies, using the Standard Statements we are providing. These would then be pinned to a specific GPS location, to produce our own global poverty map, for cross comparison with the relevant UN-released maps.
For now, you will just have to find ways of sharing them between yourselves, through emails, through hyperlinks, through forums and through social networks. If anyone uses Twitter or Weibo, try publicising your Studies with the hash tag #PovertyProfile and include your Country, your closest City, your 7 numbers separated by commas (water first) and maybe a URL to where you have uploaded the full data – if there is space for all that in Twitter’s 140 characters!
So that’s relative poverty: owned. Now, whether you are chalk or cheese, get to it! Let’s see how quickly we can get this trending worldwide.
And thanks again for being…
One in a Billion!