
There are over 7 billion people in the world. Every one of them is unique.
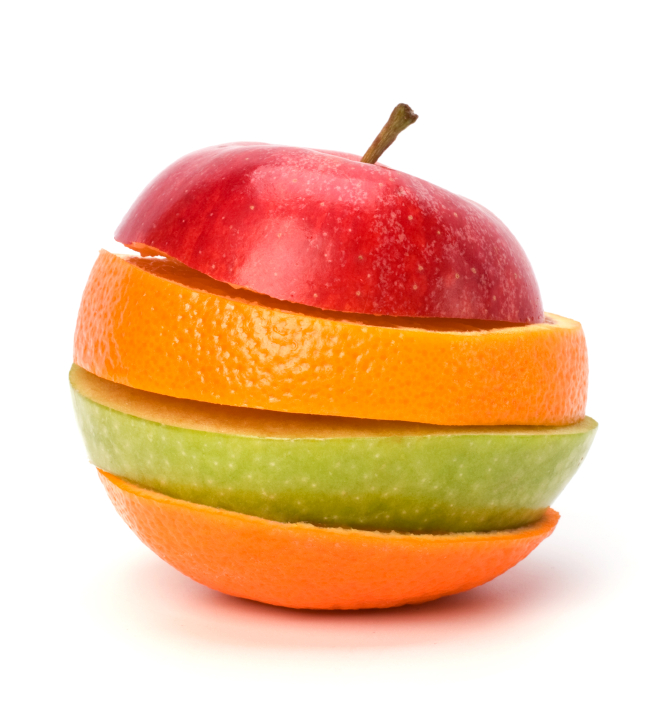
And yet, at the same time, not so very different that some comparisons aren’t possible. Even beneficial. Recognising the risk of trying to compare “apples with oranges”, we believe the 7 Layer Poverty Model can be used to assist us with comparisons between all people, using a set range of criteria, to enable us to develop a POVERTY PROFILE for every one them. Including YOU.
In this article, you will learn:
- How to conduct a complete Simple Assessment and Study
- How to use the Assessment Scores to create Poverty Profiles
- The key differences between Detailed and Simple Assessments
- How Simple Assessments can be used retrospectively to better measure Return On Investment for aid projects
- How Simple Assessments can be ‘self-conducted’, run by a supervisor, or through group discussion for contentious answers
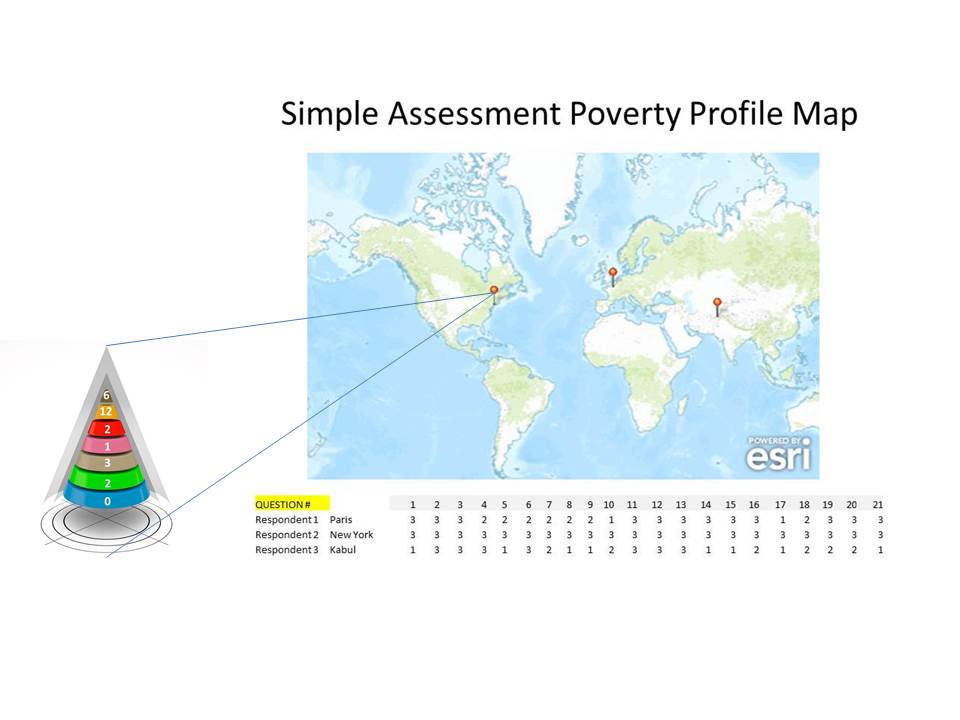
- How all results can be ‘pinpointed’ to the respondent’s location on the planet, to build up a geographic information system (GIS) with the data.
- The special mathematical power within the Simple Assessment.
The Poverty Profile consists of a compound score for ANY individual on the planet, in each of the 7 Humanitarian Basic layers of the Poverty Model. Within each layer, we arrive at a score for each of the 3 key factors regarding that Humanitarian basic, namely the relevant: Attributes, Access and Availability measures for each one. In each of these 3 areas, using the Simple Assessment method, we measure the individual’s situation based on a high/medium/low/none score. In the Detailed Assessment, we follow a similar measurement process, but against a range of possible scores from 0 to 9, allowing for greater differentiation.
In both types of Assessment, the scores are multiplied and compounded, rather than added together, giving us a composite score in each of the 7 layers of the model. The 7 scores then combine to give an overall Poverty Profile for the individual.
One can also add up the 7 composite scores to provide a rather more crude, overall ‘summary score’, but only if the relative simple parameters of the Study concerned justified it. Such a summary score, in our opinion, would obscure a great deal of more useful information in the data, that had already been collected.

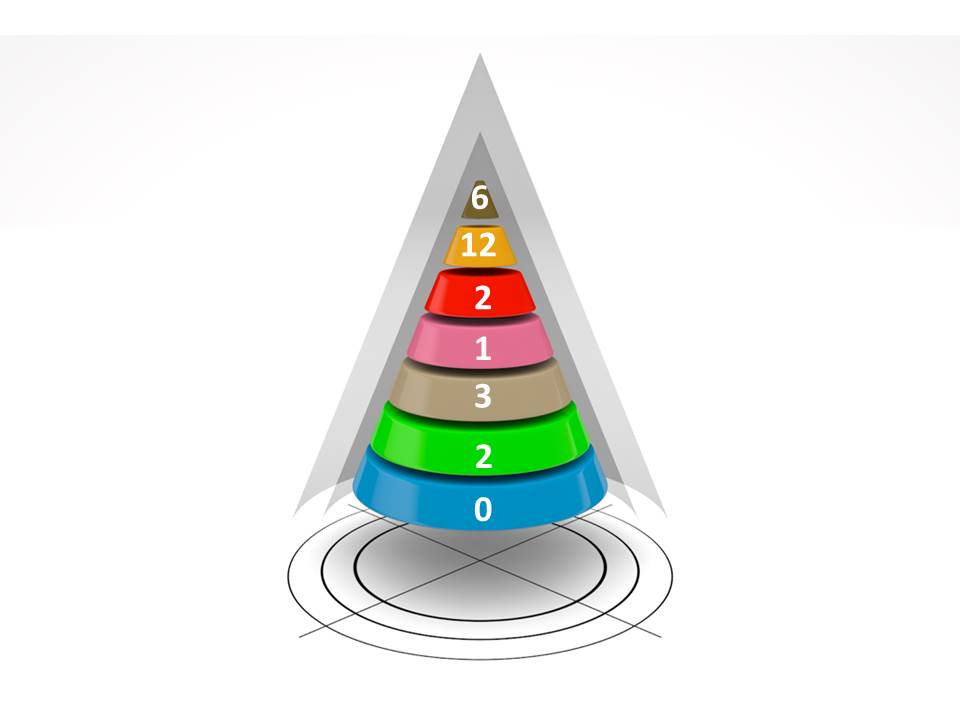
By default, we start the Profile with the most pressing Humanitarian Basic need first – that of Water. Each layer has a maximum score in the Simple Assessment method, of 27. Thus, when using the Simple Assessment approach, the maximum an individual could score across all 7 Humanitarian Basic layers would be 189. In relative terms, a person scoring 189 in the Simple Assessment would not typically then count as ‘poor’ compared to a cross section of their peers, on any of the 7 Humanitarian Basic measures.
However, using the more exact Detailed Assessment, there can be greater differentiation and associated scoring of individuals. With the Detailed Assessment, each Humanitarian Basic is scored out of 729 (ie 9x9x9), with the maximum total for all 7 areas therefore coming to 5103. By having such a widely differentiated range of scoring possibilities, it extends the range of useful application of the Detailed Assessment globally, so that the ‘very rich’ can still appear on a single, logical, quantitative scale, that also includes the poorest people on the planet. It allows for a more in-depth and sophisticated comparison across multiple poverty metrics, rather than the one-dimensional GDP per capita figure.
Considerations regarding the relative merits of applying the Detailed Assessment method, versus the Simple Assessment method, are covered in the ‘Measuring Poverty’ article, accessible from the Main Menu on this site. For now, our focus remains on the Simple Assessment, for which we anticipate more widespread global application.
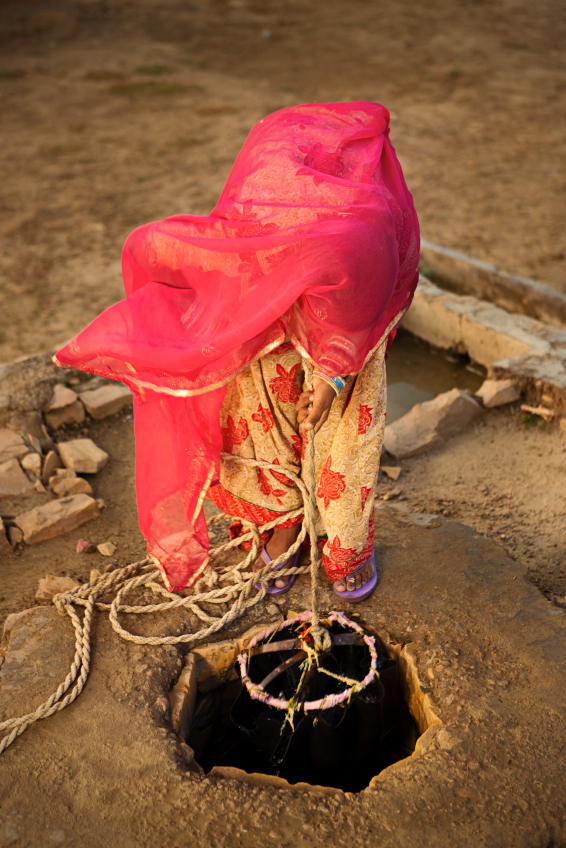
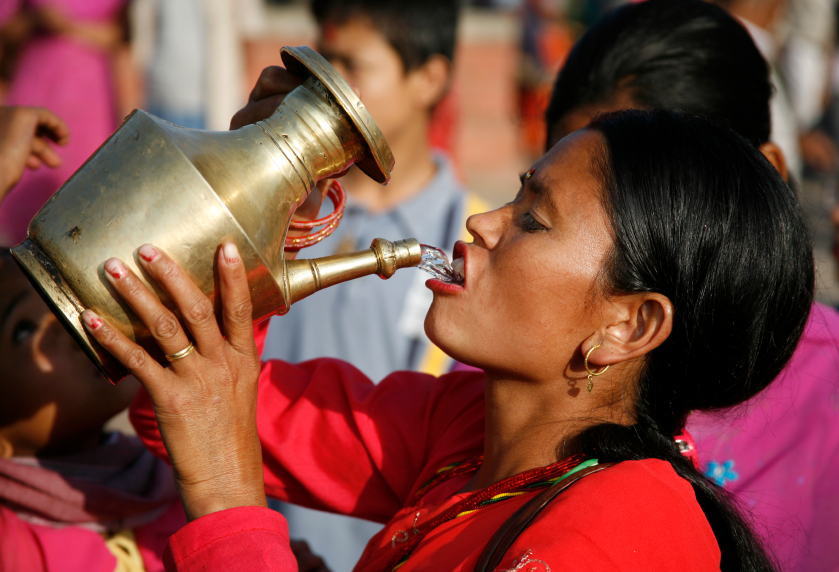
As mentioned above, the lowest section of the 7 Layer Poverty Model refers to Water. It forms the base of the ‘cone’ of layers, because it is considered the most important. We recognise that globally, water is and has long been used, as a common resource for sanitation, hygiene, irrigation, livestock, recreation and various other purposes – simultaneously. In terms of modelling the 7 Humanitarian Basics, sanitation and hygiene (although typically involving water) are clustered together within the Shelter layer. As a component of Shelter, hygiene and sanitation elements are seen to fit more logically overall, alongside other vital elements like fuel.
In the Poverty Model, any Assessment for an individual regarding the ‘Water’ layer, thus specifically and exclusively refers to drinking water for humans, not livestock. This is to highlight water’s distinctive and vital role in preserving human life and health. There are records of people regularly surviving for weeks without food. However, depending on environmental conditions, few humans ever survive more than 2-3 days without suitable drinking water. As such, it presents itself as our most urgent and immediate biological need.

Thus, it is first on our list of things to be measured among the 7 Humanitarian Basics. We will therefore use it here as an example of the challenges and opportunities we face in carrying out a ‘Simple Assessment’. The Assessment (whether Simple or Detailed) is the method by which we measure and record the 7 Humanitarian Basics for an individual, at a given point in time.
The World Health Organisation has accomplished a lot of good work in determining what aspects of water quality can be usefully measured. In 1996, it produced the second edition of its ‘Water Quality Assessments: A Guide to Use of Biota, Sediments and Water in Environmental Monitoring’. It runs to over 600 pages! It is well-informed and detailed, but admittedly hard to apply comprehensively for our purposes. Chapter 3 specifically covers the selection of water quality variables. In the introduction to the chapter, the report states: “The selection of variables for any water quality assessment programme depends upon the objectives of the programme“. It recognises key, common programme drivers, like efficiency and cost effectiveness. Anyone wanting to research such water quality matters further, is directed to the WHO’s more recent ‘Guidelines for Drinking-Water Quality Volume 1: Recommendations, 2008’, available for download over the internet.
It goes on to list a number of those potential sets of variables that people may wish to assess. That list is divided into ‘hydrological‘ variables and ‘general‘ variables. The latter cover such things as temperature, colour, odour, residues, clarity, pH level and various other chemical properties. With the exception of the chemical properties, all of these can be subject to basic, subjective assessments by the normal human senses. Biological content can be assessed for its potential harm for humans by experiential evidence from frequent users of the relevant water source, where available.
Taking our cue from this WHO guidance report, our approach is intended to be simple, practical and capable of assessment by non-specialist human beings. Hence, the Simple Assessment method for Water (as with all other Humanitarian Basic levels) is via a simple question and response technique. This makes it flexible enough to apply easily and readily to widespread language scenarios. The English words can be fed into Google Translate, or similar tools, to give a first-pass translation into other languages, if required. This first-pass version should then be cross-checked for accuracy and refined as necessary for actual application in any given Simple Assessment study, with a local-language speaker.
Where language and understanding of the terms is unlikely to be a significant issue, the entire exercise can be completed on a “self-serve” basis. This might be via anything from individual questionnaires, to direct input into an online data capture system. A desire to maintain such flexibility, without the need for expert assistance on hand, is further reason to maintain simplicity in the Model and the chosen Assessment approach.

This approach therefore lends itself to multiple “crowd-sourcing” scenarios, where the individual being questioned is typically considered to be the most authoritative expert on their own experiences, which the Assessment seeks to measure and capture.
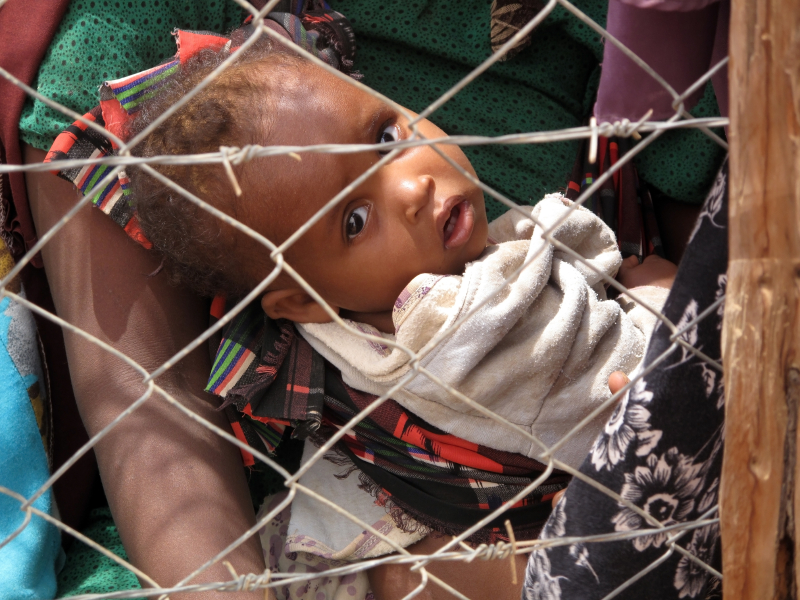
Where the individual is not best able to answer for themselves, suitable others should be found to answer on their behalf. For example, this might frequently be the parent or carer of a child, or other person, who is unable to answer the questions accurately for themselves. It might also be a literate, or technically-aware person, conducting the Assessment on behalf of a group of illiterate, or technically less capable respondents.
The underlying goal of the Assessment is to get the best available data, based on the individual’s Most Probable Choice (MPC) for each response. The Assessment proceeds with the individual being made aware of the purpose of the Assessment and the desire to identify statements that most closely reflect their own experience and status, for the point-in-time chosen for the study. A simple introduction to the basic terms of the Model and the Assessment should also be given, so that the person understands the similarities and differences between the Humanitarian Basics and the levels of possible response.
Respondents are to be helped to make a ‘most probable choice’ decision from a range of options, picking the statement that best reflects their situation, then ultimately stick with it. The desire to distinguish between responses that reflect high, medium, low and ‘none’ should be emphasized, recognising that there must be some understanding of thresholds between each. These are necessarily ‘best estimate’ in the case of the individual being assessed.
If the person asking the questions has greater experience of the meaning and relevance of such distinctions, they can assist the respondent accordingly. The goal is not to steer the respondent one way or the other, but to arrive at the best representation of the facts, reflected in the Assessment. The person asking the questions, or otherwise supervising the study, can capture any notable issues with trying to accurately reflect a given individual’s situation within the Assessment, as additional explanatory notes within the overall study, as appropriate.

The other point to make clear to the individual being assessed, is that the Assessment seeks to distinguish between the Attributes themselves, the Accessibility to those Attributes and their Availability over time. A simple illustration may help make this clear. If an individual respondent identifies their first best source of drinking water as a local stream, they may understand Accessibility being their ability to effectively obtain this water on a regular basis.
This may involve overcoming such obstacles as harsh weather, social exclusion, threat of violence, or a lengthy or hazardous journey to the water source and back. This is to be contrasted with Availability. Availability (within the Assessment) is when the source of water itself might not available for some reason. This may be due to such factors as seasonal drought, occasional pollution, or even seasonal flooding.
Once these principles have been outlined, sufficient to aide an effective understanding of the exercise, the series of responses can be sought, starting with the Attributes statements. We are looking here at Water specifically, but the same principles apply to all the Humanitarian Basics layers and the Simple Assessment method to capture the data for them all. From one perspective, it is just 21 statement choices to capture. From another, a certain amount of time may be spent in discussing, or otherwise considering the best-fit option between alternative statements.
It may well work best to guide the respondent to start with the statement associated with the ‘None’ response first. If this seems an accurate description of their circumstances, they need make no further choice on that question and can move onto the next. A good practice would be to double check that the next statement in the sequence is not a better reflection of their situation. If not, the original response can be captured.

Respondents can clearly come back and amend any answer in the light of a clearer understanding, before final capture and completion of the Assessment for the individual. They may also find it helpful to discuss the relevance and accuracy of the different options, with either the person facilitating the Assessment, or suitable others, if present. Respondents in more developed nations may well be far more used to this type of survey technique, recognising the primary requirement to find the best-fit answer, when there are no “I don’t know”, or “Not applicable” options.
So let’s begin with the first Attribute statement to consider for Water, for the equivalent of the ‘None’ measure, in English. Any translation or local interpretation required will be driven by the specific needs of the study in question. The preceding question would be something like: ‘Which of the following statements best describes [the respondent’s] own situation, with respect to their [drinking water] on [the relevant date]’. The first statement then proposed for consideration is this:
“My main best source of water cannot be considered safe for me to drink, for my life or health.”
If the respondent deems this statement accurate regarding their circumstances, then this is the answer to be recorded.
One point is worth mentioning about ‘dating’ or ‘timing’ of the Assessment. By default, it should be the time and date that the data is being captured. However, the Assessment model is flexible enough that it can be answered for a specific date in the past, to suit the requirements of a given retrospective Study. Clearly, this has the advantage that such data collection is impossible for scientific measurement, whereas the individual has the memory conveniently stored. However, the human memory is also potentially subject to error. The relevant study must determine the significance of such factors.
The great appeal is that this Simple Assessment method can still be used as a way to measure the current impact of historical events. Thus, changes over time can be measured, captured and presented from the source data. In the context of going back and assessing the impact of, and return on investment on humanitarian aid and development projects, this facility could prove very powerful.
Now, back to the individual respondent. If they decide the first statement is NOT correct, or they are unsure, then the second statement can be considered. It states:
“My main best source of water is satisfactory for me to drink if I boil (or treat) it properly, but it can still cause me some health problems.”
The distinction between the two statements, in terms of degree, revolves around the difference between ‘threat to life’ and ‘some health problems’, together with the effectiveness of possible ‘treatment’, if available. This permits the individual to contrast between degrees of impact of such health problems as dysentery and an occasional upset stomach, for example. The distinction is for the person to decide, assuming they are best-placed to comment. And so the process continues. If they are uncertain about this latest statement, they cross compare it with the next two and arrive at an overall decision, regarding Water Attributes. For completeness, the other two statement options are given below:
“My main best source of water is safe for me to drink without further treatment, but still has some odour, clarity, or other known quality problems.”
“My main best source of water is safe for me to drink. Any odour, clarity or other known quality problems are only minor.”
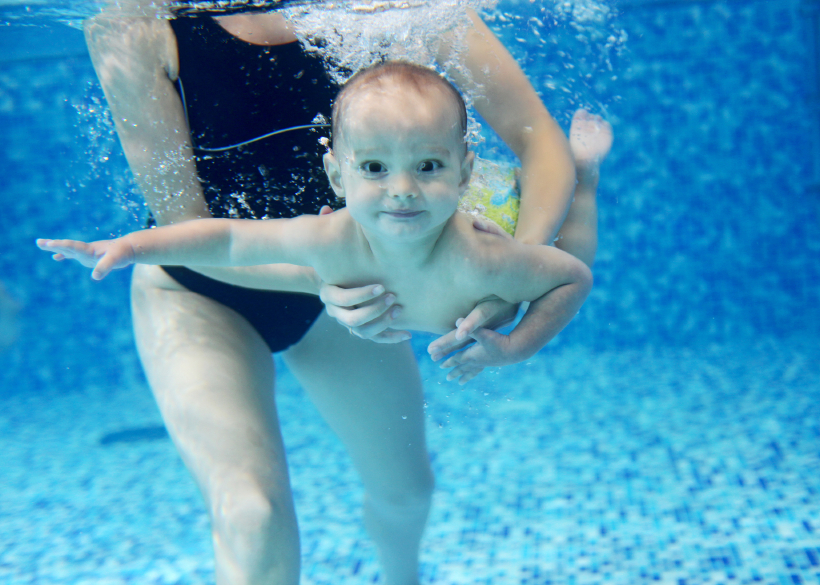
It is recognised that the wording is deliberately subjective. It means that two different people can have different responses for the SAME source of water. A robust adult, who has grown up drinking the same water for decades, may have built up some immunity to any contaminants in it. The same might NOT be true for a baby, or a recent visitor to the area. Hence, both can give different answers and both can be true.
The person experiencing health problems might have to make alternative drinking arrangements, which in turn would affect their Accessibility response for this Humanitarian Basic. People who are used to travelling internationally will be used to this phenomenon themselves, where they may choose to boil local water, or buy bottled water instead, for a time after initial arrival somewhere.
This brings us on to the Accessibility statements. The same overall suggested approach applies. Starting with the ‘None’ equivalent statement, first see if it applies, before moving on to the next statement in the sequence and cross-checking for accuracy. The first Access option for Water is:
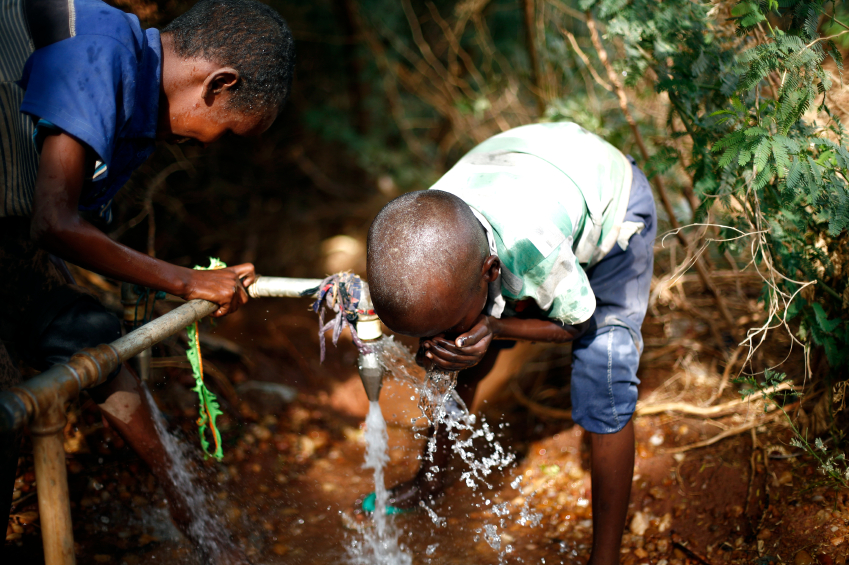
“I do not have reasonable access to enough of my main best source of drinking water within my community (under 1 hour’s return walk) for my daily needs.”
Accessibility here is given a finite limit, measured in terms of walking time. It should be recognised that carrying a household’s daily water ration by hand, will potentially severely impact the speed of the return journey! Some may reasonably argue that many in the world DO have to walk more than an hour each day to collect their water, so it is not technically correct to say there is ‘No access’. We understand that point. However, we would contend that a daily, round trip walk of over 1 hour, carrying the necessary water, does not constitute “accessibility”. Reasonably speaking, it would better fit the description of “inaccessible”.
We believe such extreme conditions faced daily by fellow human beings are exactly the kinds of realities that should be measured, recorded and highlighted as significant. This is part of what the Model and the Assessments are intended to achieve. They are not meant as a purely academic or intellectual exercise. They have been constructed to be useful and used.
Again, the Accessibility statements are intended to distinguish between low, medium and high alternatives. Compared to relatively privileged conditions in more developed nations, some of the terminology may seem overly generous. The ‘high’ measure in the Simple version of the Assessment is qualified as:
“I have exclusive household access to enough of my main best source of drinking water within my dwelling.”
One might argue that to qualify as a ‘high’ Accessibility score, an individual should have Access to ‘immediate running water from taps, or faucets’. Again, this is a fair point. However, given the range of conditions faced for Water Access by billions of people globally, our focus here is to highlight what constitutes ‘high’ Accessibility set against that context. It is meant as a relative measure. Also, remember that we are most interested here in the Simple Assessment. The alternative Detailed Assessment will allow further differentiation, as required.

Behind that broad ‘high’ measurement category, there are individual Detailed scores that could be translated as 7, 8 or 9. The ‘9’ figure would typically equate to such immediate supply from faucets in multiple household rooms, within the Detailed version of the Assessment. The place for any such finer Accessibility distinctions is therefore in Detailed Assessments, which are not our focus here. For us, in the Simple Assessment, the equivalent of a ‘7’ figure and description in a Detailed Assessment study, STILL counts as a ‘high’ in terms of Accessibility in the Simple Assessment method. More can be found on Detailed Assessments, under the Measuring Poverty tab on this site’s Main Menu.
For completeness, the full ‘Version 1’ list of statements for the Simple Assessment approach, for Water, are given below [apologies in advance to those viewing this section on mobile device screens, who may experience some layout issues]. This is intended as an ‘open source’ model. The below is given as the ‘Standard’ version, at current revision level 1.0. There are great and compelling benefits in global standardisation on such a single Standard. However, if others have more compelling reasons to adapt and change it to their own Study needs and applications, they are free to do so, subject to explicitly referencing this original Standard model and clarification of any deviation from it.
This will help others reviewing any published Studies, to know what is being compared with what and the extent to which comparisons between such Studies are viable.
| ATTRIBUTES | 3 | HIGH | My main best source of water is safe for me to drink. Any odour, clarity or other known quality problems are only minor. |
| 2 | MED | My main best source of water is safe for me to drink without further treatment, but still has some odour, clarity, or other known quality problems | |
| 1 | LOW | My main best source of water is satisfactory for me to drink if I boil (or treat) it properly, but it can still cause me some health problems | |
| 0 | NONE | My main best source of water cannot be considered safe for me to drink, for my life or health | |
| ACCESS | 3 | HIGH | I have exclusive household access to enough of my main best source of drinking water within my dwelling |
| 2 | MED | I have exclusive household access to enough of my main best source of drinking water within the grounds of my dwelling | |
| 1 | LOW | I have free access to enough of my main best source of drinking water, shared within my local community, for my daily needs | |
| 0 | NONE | I do not have access to enough of my main best source of drinking water within my community (under 1 hour’s return walk) for my daily needs | |
| AVAILABILITY | 3 | HIGH | Thinking about my main best source of water, it is available over 95% of the time. I can readily rely on other drinking water sourcing and storage options at other times. |
| 2 | MED | Thinking about my main best source of water, it is available over 75% of the time. I can usually rely on natural water storage for other times, or manual storage in emergencies. | |
| 1 | LOW | Thinking about my main best source of water, it is available over 50% but less than 75% of the time. I have to rely on storing water manually at other times. | |
| 0 | NONE | Thinking about my main best source of water, it is available less than 50% of the time. I therefore consistently have to rely on storing my water manually, usually on a daily basis. |
Within the Simple Assessment, as described above for Water, the exercise will deliver 3 separate figures. Within a given Assessment of an individual, these 3 figures should be identifiable within the presented data, so reviewers can ideally ‘drill down’ to it. However, even for a single individual, this will generate 21 separate items of data. There is thus some benefit in arriving at a compound score in EACH of the 7 Humanitarian Basics, to create a simplified, overall ‘Poverty Profile’, made up of 7 figures for the individual, from the Simple Assessment process.

This compound figure is achieved by MULTIPLYING each of the 3 scores, from each of the 3 areas of Attribute, Access and Availability. This is considered more useful than simple addition, for a number of reasons. This is perhaps most graphically illustrated in the context of those individuals with ‘None’ responses.
Consider a person used to having good quality water in their home all year round, from a well located in their household. In a severe drought, or for other reasons, that well may dry up, with the next best source of water being over an hour away. In that case, the respondent might give a 6 out of a possible 9. That does NOT best reflect their human condition, in our view. This is the power of multiplication instead. If you multiply anything by ZERO, it becomes zero. Thus, a person facing a severe relative shortage of any Humanitarian Basic will register in any such Study & Profile, with a zero.
The mathematicians among you will have worked out from the above, that in the Simple Assessment, the MAXIMUM score for an individual for any Humanitarian Basic, is 27, ie 3 x 3 x 3. Where a person selects statements that correspond to ‘high’ scores for Water Attributes, Access and Availability, they would score a maximum Simple score of 27. This allows a wider range of comparative scores than simple addition – all the way down to zero. Any individual scoring a zero in any of the 3 assessment areas for Water, will end up with a net score for Water of zero.

That method of compounding the 3 contributing figures, enables us to direct priority focus on their relative overall ‘score’ and gain some quantitative measure, of their associated, qualitative experiences of ‘poverty’. This, after all, is the underlying purpose of having the Poverty Model, the Simple Assessments and the resulting Poverty Profiles that they generate: to give us useful tools and information that we can then act on, to help overcome more poverty sooner.
Notice some mathematical implications of the Simple Assessment scores. Anyone scoring a zero is clearly in what we might term a ‘crisis ‘situation. Anyone scoring 6 or under is facing what most would consider a form of ‘extreme poverty’. A score of 6 or under can ONLY be achieved if one of the 3 areas of Attribute, Access or Availability scores a 1. Any score over 10 indicates a person who is relatively better off, since all three of the scores must be 2 (medium) or above, with at least one 3 score.
Scores of 8 and 9 require further analysis of the underlying data. A score of 9 can only be achieved with two 3’s and a 1. A score of 8 can only be achieved by 2x2x2. In the case of a 9 score, a targeted response to address the root cause of the ‘1’ score in that area might be merited, based on the data. The nature of the intervention would depend on the underlying cause of the low score in the one area. This is the power of the mathematics! There is only one compound number, but it can only mean a specific and limited range of underlying numerical causes – and hence, interpretations. It also maintains the relative measure element, with some option for ‘relative poverty’ comparisons between those scoring 8 or 9, on a case-by-case basis.
Let us now consider how a Simple Assessment for Water and the resulting Poverty Profile score might work in different potential, real life situations – and for different individuals. Firstly, the drought example given further above, where the individual was used to a ‘highly’ accessible source of ‘high’ quality water. Both Assessment scores would therefore be 3.
However, thinking about availability of this source in a drought, it would be unavailable 100% of the time, in an extended drought that caused the water table to fall below the level of the well. This would qualify for an availability score of zero. In that situation, the person would have to find another ‘main best source of water’ at the time of the Assessment, as long as the drought was expected to continue. This raises a valid question. If the drought had continued for some time, should the individual have changed their answer for their main best source of water?
We would suggest not, for a couple of reasons. Firstly, there is the issue of ‘most probable choice’. The MPC for that individual would be the water in their own household, NOT the source they resorted to in the emergency drought scenario. The second point has to do with how the different answer might be interpreted. The value of the zero compound score accurately reflects the immediate plight that the individual is in. The person conducting the Study should make reference to the drought conditions within the relevant additional notes for the Study. Where such a drought causes needs which are urgent and severe, they should be a priority case for any given humanitarian response. Such a response might come from the Community (based on their ‘closeness’ to the individual), or any of the 4 sets of other stakeholders the Poverty Model lists.
By comparison, in the example above, if a reviewer looked at a set of response figures based on an assumption of using the more remote alternative water source, they may form an inaccurate view of the underlying situation – and hence the best options to resolve the matter. In this specific case, one might conclude that in this drought, the person should move from their home to be closer to a reliable source of good quality water – for example, a purpose-built refugee camp.
With more accurate data, the reviewer might understand about the domestic well previously being a good source of water, and that the best solution might be to simply dig the well down a few metres to reach the lower level water table all year round. In terms of the Poverty Profile compound score calculation, both approaches deliver the zero result for Water, but one provides better quality diagnostic data overall.
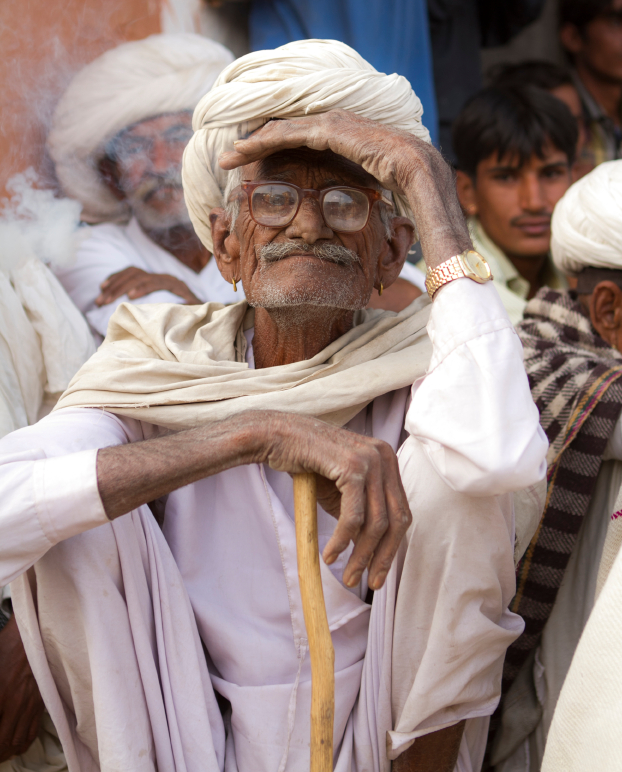
Now let us look at a social exclusion example, as may potentially occur, for example, with the ‘dalit’ caste in India. A dalit, or ‘untouchable’ in India may score with reasonable Assessment marks in both quality of water source and availability. If, however, they are socially being excluded from access to that source by other ‘higher’ castes, then the Simple Assessment score for Access will be correspondingly low.
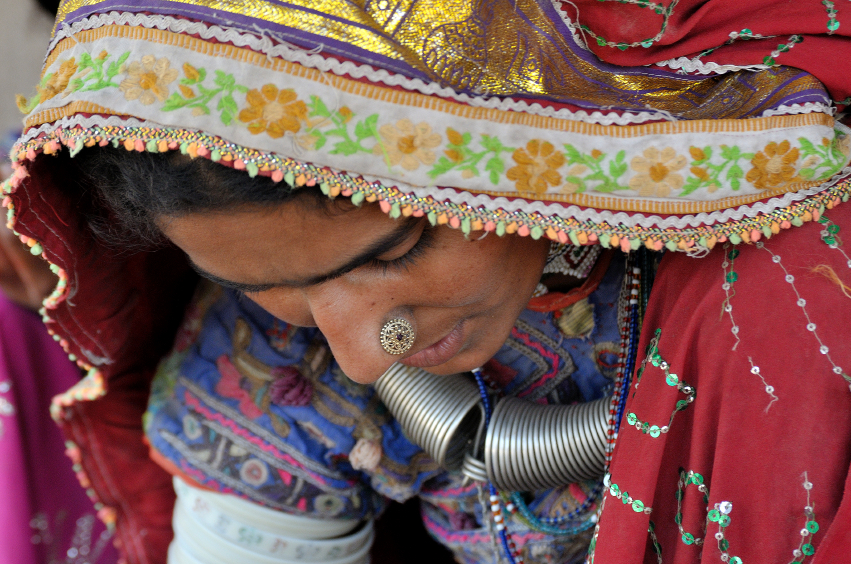
Anyone reviewing the data and drilling down into it, would understand that the issue of any low compound score here is one of Access, NOT water quality or availability. Similar scorings might equally have been highlighted for historical social exclusion scenarios, such as African Americans in parts of the USA before the 1960s, or ‘apartheid‘ era South Africa. Social exclusion as a contributory factor of poverty is nothing new; nor is it restricted only to less developed countries.
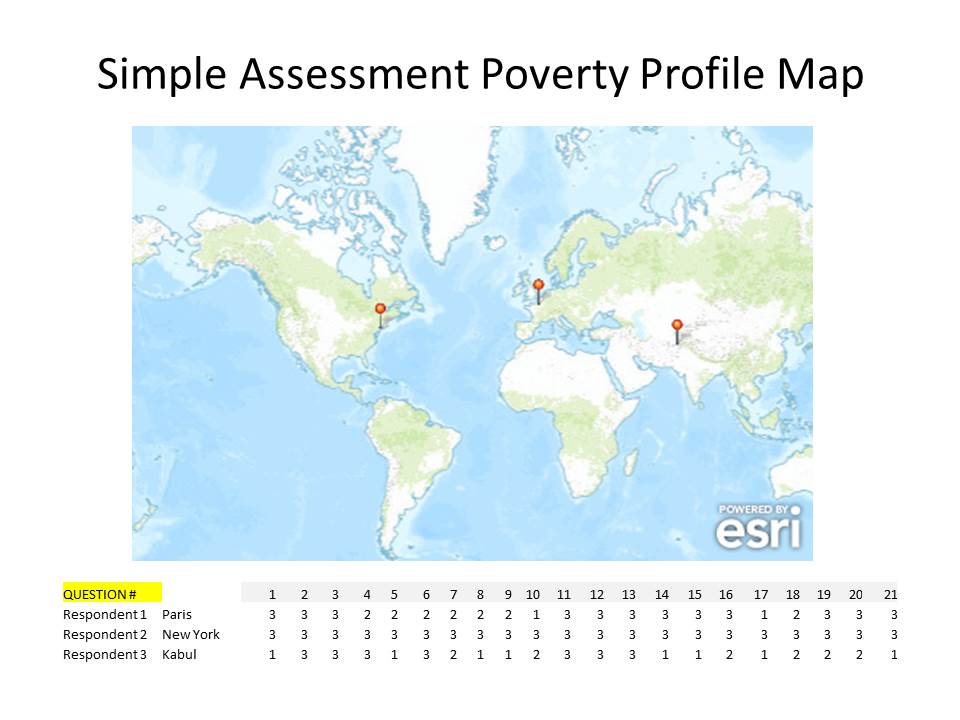
This level of distinction in the data can help with policy decision-makers. It will help avoid any diversion or resources to drill more wells, or secure fresh water supplies, in cases where the underlying problem is one of ACCESS, not availability. In the example given, it is a social exclusion problem and will likely have a political solution. The international NGO Christian Aid, in a recent report (‘Building the Future of Humanitarian Aid’), identified this as an issue actually experienced on the ground, in delivering certain relief supplies to certain communities in India. The supplies they were distributing were of good quality and readily available, but they discovered that dalits were being bypassed in their actual distribution. This detail was discovered in the field, but is the kind of data that could be highlighted remotely, where the reviewer can drill down into the source data, as illustrated in the diagram and data extract below.
In the above ‘dalit’ access issue scenario, a similar social exclusion mechanism was manifest in the relief efforts to build new properties, where the individuals were asked to pay for their own foundations, before the government grants were triggered, to fund the rest of the house construction programme. This had the effect of excluding the dalit community from access to the building aid budget available, as they typically could not afford to pay for their own foundations, and therefore could not gain access to the other funding available. In both cases, the NGO was able to engage in political advocacy with the relevant Indian Government authorities and secure an effective political solution, which included access for the dalit communities.

In conclusion, we can see that the Simple Assessment process and the 7 Layer Poverty Model, have great potential for flexibility, adaptation, accuracy and relevance to a wide range of real-life development, aid and poverty scenarios. More can be found elsewhere on this site, regarding the other Humanitarian Basic layers and their relative Assessment considerations. It is hoped that the above illustration provides you with enough information to consider how the approach could apply to YOUR particular needs.
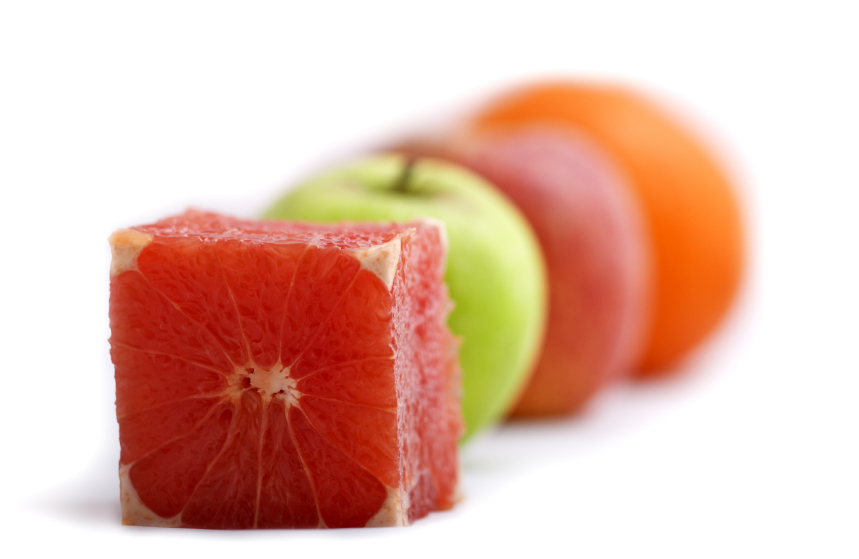
We believe it will bring great benefit to situations where stakeholders are looking for a more quantitative way to incorporate qualitative data into a consistent, flexible, integrated, relevant and powerful global model. It is our best effort at potentially comparing what may, initially, seem as incomparable as ‘apples, oranges and grapefruit’.
If you would like access to the full ‘Version 1’ Simple Assessment Excel spreadsheet, you can download it here. We are happy to engage via the Contact Us’ page with anyone planning to conduct and publish an actual Study using the Simple Assessment.
Until then, it just remains for us to say, thanks again for being…
One in a Billion!