FOCUSING ‘FIXERS’ ON IMPACTS
Our condensed 7 word plan for solving poverty is: define poverty; map poverty; focus the fixers (6 words if you leave out “the”). We have written elsewhere an introduction to the third step of ‘focusing fixers’. You may find it helpful to read that article before you delve into the detail of this one. Here, we plan to expand on how fixers can focus more on outcome impacts, through the effective mechanism of MEASUREMENT.

The 7 Layer Poverty Model takes advantage of a specific definition of poverty, that we can use effectively for measurement. Our proposal, in the absence of some better tool, is to use the metrics from Simple Assessment Studies or estimates, to provide an approximation to the overall impact of any course of action, or poverty reduction initiative. This is a useful approach for comparing and choosing between investment decisions BEFORE any commitment of resources has been made. The same tool can be used to conduct a separate Simple Assessment after the particular project, allowing decision-makers to assess the ACTUAL impact, versus the PREDICTED impact.
A COMMON GLOBAL MODEL FOR DECISION-MAKING?
We are going to stick our necks out here. Almost all decisions made by any group anywhere in the world ever, have 3 KEY COMMON COMPONENTS. Like we said – necks out. All decision-making can be better understood by gaining a better idea of how those 3 components operate and affect the resulting DECISIONS. We are particularly interested here in how those decisions help us solve poverty, but they apply equally to all types of decision. They are:
- The Decision-Making Unit (DMU)
- The Decision-Making Process (DMP); and
- The Basis of Decision (BOD).

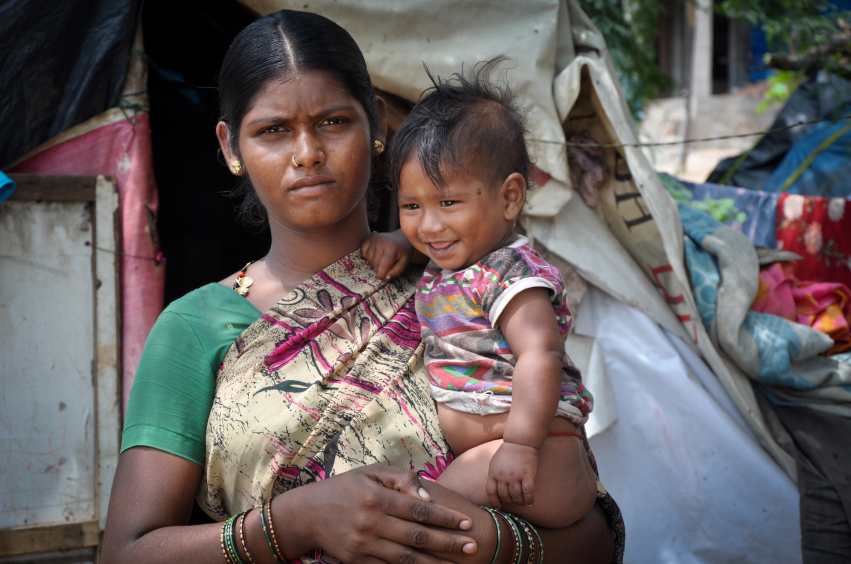
The DMU can be anything from an individual, through to the entire national voting mechanism of the World’s largest democracy (India), which is currently under way in April 2014, with over 800 million people potentially involved (ie. the ‘electorate’). The ‘decision’ in this latter case, is who should be elected into national political power for the next term in office. But at the other end of the scale, the decisions the individual makes can be as simple as ‘shall I have a coffee now?’ Both the individual and 800+ million Indian voters constitute ‘decision-making units’, for those different scenarios. Thankfully, we don’t need to ask 800 million people every time we want make a decision about a cup of coffee. Imagine the wait in line at Starbucks!
And this is partly our point. We give various decision-making tasks to various different groups, of all shapes, sizes and memberships – but they are all DMU’s. There is no single PROCESS for all such decisions that they make, but they still all FOLLOW a process – however, haphazard and obscure such processes may sometimes seem, or indeed be. Some people may make serious life decisions based on horoscopes, or a throw of the dice. Elsewhere, the decision-making process may be by such things as secret ballots, canvassing opinions, a ‘show of hands’, or it may just be that whoever is considered the overall leader has to make the final decision – as will often be the case in military decisions and organisations. At the other end, you may have made some of your own decisions on the toss of a coin, or by trusting a “gut feeling“. In all cases, there was a process. The same is also true of our fixers, when it comes to making their decisions about tackling poverty.

Countless decisions, by government politicians, NGO Boards, multilateral Councils and their various equivalents, are made around the world, in the common pursuit of solving poverty – always following their respective processes. In many cases, the process will include the presenting of information, before the relevant members of the DMU assess that information (through internal or external discussion and debate) and then move towards a decision. That decision may be put to some kind of majority vote, left to a single individual, steered towards or consensus, or deferred. However, even a decision to defer a decision is also a decision itself. Such DMP approaches have been used worldwide for centuries – even millennia. But what of the flawed and fallible people who MAKE those decisions?

Their individual BEHAVIOUR is determined by the third item on our list: the Basis of Decision. The BOD is perhaps the hardest element to work out, for each individual involved. We recognise that information of some sort will typically have been shared, before any decision is sought. However, it would be wrong to assume that all decisions are made on the basis of the content of that information alone. There may be all kinds of other factors influencing the BOD of each member of the DMU – and each individual’s BOD may itself be different – sometimes significantly so.

A simple illustration would be the example of a bribe. If a member of the International Olympic Committee has to vote on the selection of the next City venue for the Olympics, it is conceivable that they may make their decision based on the expectation of a bribe – rather than the specific merits of any given city, or the information presented about it. (We neither confirm nor deny such ideas; we merely state that they are conceivable). In other circumstances, individuals in decision-making meetings may have some less obvious vested interest in a particular outcome. They may also simply dislike the person making the proposal, so will vote against the ideas based on that negative feeling, rather than a lack of compelling information. On a more positive note, people may be inclined to vote based on conscience, faith, practical limitations, personal fears, differing risk assessments, or just plain strength of “gut feeling”. They may not even be able to explain to you exactly WHAT their BOD was, after they have cast their vote. As human beings, we regularly have to operate on limited information – and even the information we do have may itself be misleading.

One of the areas where this is currently globally evident is around the complex area of global climate change. In this arena, we find lots of passionate debate, by various experts, around what the likely future climate scenarios will be and the best ways to respond to them. Gathering the ‘fixers’ to solve poverty can sometimes appear equally challenging. However for poverty, there is no single, internationally recognised group, interfacing as a ‘boundary organisation’ between decision-makers and differing expert opinions, with the overall brief to arrive at a consensus. For climate change, there is the IPCC (Intergovernmental Panel for Climate Change). For poverty, which is literally killing millions more every year than climate change, there is no such consensus body. Even if there was this single DMU, it would clearly not replace the many other DMUs, DMPs and BODs that would still continue to operate around the world every day.
A MORE STRUCTURED APPROACH TO DECISION-MAKING
So how can we FOCUS all the disparate groups collectively involved in overcoming poverty better? We have no plan for changing their DMUs, but would welcome the global equivalent of the IPCC for poverty. We have no alternative model for their respective decision-making processes either. The KEY area where we advocate improvement, is in their respective BODs. This may in turn influence change in the other 2 key decision-making elements, but that is not specifically our agenda here. We firmly believe that better quality information will facilitate better quality decision-making overall. The 7 Layer Poverty Model provides a compelling conceptual framework for a better understanding of what poverty is and how it can be overcome more effectively in a co-ordinated way.
We have proposed and included below an Excel spreadsheet, that incorporates certain ideas for focusing fixers. ‘If you want to improve in any area, measure it more frequently’. People tend to focus more on what they think they will be measured on. Regarding improving the BOD on any and all decisions being made with respect to solving poverty, we want to focus attention on measuring output impacts for given project ‘inputs’. These range from your own individual decisions about where you invest your own time, efforts, energies, attention and resources – to where the UN and the European Union decide to invest theirs. We believe that the final BOD on behalf of all public and charitable bodies can be much clearer and more transparent than at present – and we want to help make that transition a little easier.
Investment Priority Evaluation Template_V1_April 2014
25 WAYS THIS TOOL WILL HELP YOU
We have come up with 25 useful things that the spreadsheet above helps bring out. There are more, but these will do for now. We suggest you download the spreadsheet and ideally have it open (or a copy of it) so you can cross check each point we make.
- The first column is entitled ‘Item Ref’, as any user of the sheet may wish to allocate their own unique internal project code, or identifier. Each separate line of the sheet may be allocated to parts of an integrated project, that may have different kinds of impact benefits in different layers of the 7 Layer Poverty Model. An example might be a village water project, intended to have drinking water, health and sanitation (shelter) benefits, all from the one project. This can be represented as 1 cost line and multiple benefit lines, or the overall cost may be divided between the multiple benefit lines.
- The Poverty Model category relates to the most relevant layer of the 7 Layer Poverty Model, that any project or initiative fits into.
- The list of Project and Program types will be a list that is most relevant to the organisation using the sheet. We have included a range of visible and varied types, which are evident in public literature on solving poverty. Our short list of 21 items illustrates just how varied those poverty reduction initiatives can be.
- We have shown project cost in thousands of US dollars, as a recognised international currency standard. This is perhaps easier for international sharing. Clearly, the currency header can be changed, along with later calculation columns using the cost figures.
- The next 3 columns deal with measures for Importance, Urgency and Ease. These are intended to relate to these factors in the destination location for the activity, meaning how urgent the felt need is ‘on the ground’. We have proposed a system where 1 is the top priority, so the smaller the number, the greater the priority. It could equally be used the other way around, such that the higher the number, the greater the priority. It is the user’s choice. Each organisation must determine its own set of criteria for determining importance, urgency and ease. Importance may be driven by assessed impacts on lives, health and quality of life measures for estimated total populations. Urgency will typically reflect the relative effects of certain inflexible time pressures, such as drought season dates, harvest times and time to exhaustion of current key supplies at current consumption rates. Ease will reflect multiple compound conditions that all operationally help or hinder activities.
- The figures for urgency, importance and ease are then MULTIPLIED in our system. This increases the effect on the overall scale of possible resulting numbers. It is intended to reflect the compound benefits and prioritisation of things which are important, urgent and easy to fix. These would typically commend themselves as top priorities on these metrics alone – in terms of operational project desirability. The ‘ease’ measure only reflects in-location operational constraints, rather than other wider potential constraints.
- All the columns have Excel Filters activated, to enable the user to show just the rows of a given type, or ranked high-to-low, or low-to-high. This enables quick and easy cross comparisons between projects on different rows.
- The right-hand side of the sheet comes on to deal with IMPACTS. In the absence of some better measures, we propose the number of people impacted is a key measure. Note, we have only assumed positive impacts, but recognise that some may need to reflect potentially negative impacts too and will need to amend this basic template accordingly. The number of people in all cases will need to be a best estimate, rather than no estimate at all. Assumptions which any estimate is based upon can be recorded as notes on the sheet as necessary.
- The people number estimates are divided into ‘first year’ and ‘lifetime’, recognising that various organisations may need to show progress and results in different timeframes. Projects may need to be broken down into phases, such as construction and maintenance phases, for example. The different time periods allow decision-makers to make comparisons between possible short term goals and long term objectives.
- The ‘average model score increase’ may be different between the first year and lifetime of a project. In all cases, an average assessment may be challenging, but the aim here is the ‘best available data’, rather than ‘no data at all’. When projects are undertaken, there is a reasonable expectation that certain individuals will benefit in certain ways. These should be measurable in most cases by the Simple Assessment method. Otherwise, some alternative key performance indicator estimate will need to be used. The average score is suggested, as some may benefit more than others. For example, a new water pump will benefit more remote households less than those in its immediate vicinity.
- The numbers of impacted people are then multiplied by the average model improvement impacts, to give a total year 1 score and a lifetime score. The significance of appropriately measuring the lifetime scores in terms of benefits becomes apparent. This may assist with an understandable tendency towards short-termism in certain scenarios. For example, those with elections coming up may be pressing for quick progress on certain key publicity projects, while there may be significantly greater benefit for projects that deliver long after the elections are decided.
- In the absence of some better measure, we propose the overall ‘Model Improvement’ per US$1000. This might equally be any other relevant currency unit, or unit scale of measure, depending on the needs of the assessment. A village will clearly be looking on a different scale than a nation, but they can still both use the same common principles of impact measurement.
- The 2 yellow shaded columns relate to INTERNAL factors within the organisation. The last column might be used to identify various project stages, such as: under consideration, approved, under way, maintenance phase, completed and so on.
- The other yellow column is an internal weighting factor. There may be various things that determine this number, which are organisation-specific. They may relate to the kinds of things sponsors are particularly pressing for, or there may be reasons that the organisation wants to make a particular project type a higher priority – such as a proof-of-concept, or pilot study projects. There may also be external factors too. Action Aid in the UK has a commitment from the UK government to MATCH any donations given by a specific date this year, specifically related to a gender equality initiative. Hence, they may weight the programme more heavily up until that date, as effectively half their associated costs would be externally matched. The single weighting factor allows for a consolidated, overall internal assessment of how different projects might suit different organisations. The “impact” figure that results may simply be used for internal decision-making purposes.
- There is quite a dramatic difference in the impacts of certain initiatives when measured this way. A certain amount of ‘sanity-checking’ between impact estimates and other projects is wise. Any significant anomalies can be referenced and explained in notes within the sheet itself.
- One of the things that may be identified, is where certain projects may NOT be to an organisation’s strengths, but could have significant impact increases, if completed by a collaboration partner. For example, when building wells, one organisation may be set up for construction. Another might be set up for re-training local farm labourers as mechanics. The former might share the benefit of the ‘lifetime impact’ figures with another organisation, which can train the engineers to keep the water pumps repaired. This way, significant lifetime benefit increases can be shown with minimal increase in costs. This highlights the multiplied benefits of collaboration between organisations, when overcoming widespread poverty.
- Note that the internal weighting factor we used worked on a scale of 0-10. This permitted fractions, where a given project was not in an organisation’s core skills to deliver.
- The types of projects listed range from direct local action to high-level political advocacy. Both have their merits. At the higher levels, where multiple organisations may be conducting advocacy, co-ordination between those organisations on the commonly-agreed benefit estimate would be more compelling than a diverse range of estimates. By contrast, we have included ‘Shoes Project #1’ as an example of the “bright idea” project, where organisations think of something that they intend to capture the public imagination. In this case, the idea was to send 1000 pairs of shoes from Europe to the poor in Africa. In practice, the project would be very expensive and time-consuming, yielding little actual benefit. However, it might be the kind of thing that captures media attention and free publicity for more impactful projects.
- The model improvements are calculated by working out theoretical (but possible) numbers for the relevant individuals on the relevant sections of the Poverty Profile of the individual. This is all condensed into a single number for calculation purposes. In the average model score increase for year 1. within the cell, the component calculation is shown. It is possible that the calculations happen on a different sheet (eg a Simple Assessment source sheet) and the resulting Poverty Profile numbers can then be fed directly into this sheet, for impact calculations. This helps reviewers understand the origins of the different impact measure calculations.
- The significant impact of the ‘zero’ effect on overall totals, can be seen with the Africa Water #1 project. In the imagined scenario, the availability and accessibility of the community water supply were already ‘high’, but the pollution of the existing supply required an urgent newly-drilled replacement well. This turned a zero figure into the maximum 27 figure on the impact assessment model improvement. This highlights the potential for certain ‘quick-wins’, with dramatic potential improvements possible in certain situations. This scoring system will help highlight such projects and so help motivate fixers to take swift and effective action on them.
- The difference between certain projects can be well-illustrated using this approach, The cost of building a primary school is illustrated Africa Primary School #2. It’s impact can be measured directly by how many pupils can be expected to attend that school. However, many of those pupils might still attend ANOTHER school, of that new school wasn’t built. So the new school impact should really be measured in terms of convenience and NET increase in school attendance numbers. School projects may be popular with locals, as it can directly save them significant school costs per child. In that respect, the project is changing the accessibility to the Engagement aspect of primary school education, rather than its availability, or its attributes necessarily.
- In terms of child sponsorship, it may be that the ability to purchase uniforms and materials is the key requirement, having the biggest net impact on local school attendance. Having a measurement system like this gives a more analytical way to compare overall positive impacts per donor dollar, for different kinds of solving poverty ideas. Providing transport to a school and child sponsorship within it may prove more cost effective than building a new school, for example. Only accurate assessment based on informed local insight can tell.
- It is recognised that the higher levels of the Humanitarian Basics can be more challenging to quantify, in terms of impacts. The example of advocacy for freedom of the press in Civil Liberties #3 illustrates this, The number of people impacted over the lifetime of such a project could be very high, but there is also a risk component attached. The lobbying may take place and no change could occur. This could be reflected in the internal weighting measure, Such higher risk projects may be better shared with other organisations, who also share the costs.
- Remarkable claims should ideally be backed by remarkable levels of evidence to substantiate them. Hence, if the number of people impacted in a project lifetime runs into thousands or millions, then clearly decision-makers will want to have such claims backed up by more rigorous research data. It may even merit a pilot project to further back up the claims in practice.
- The columns, calculations and project examples are our own. The 3 decision drivers of importance, urgency and ease of execution have been tried and tested. The application of the Poverty Model improvement measures is new. Our purpose is to give decision-makers a flexible tool and an idea of how to use it to arrive at better, more structured and more consistent decision-making. Users are free to adapt it to come up with better versions themselves. The common goal is to help focus fixers on maximising their output impacts, in the interest of overcoming more poverty sooner.
We trust that you find this examination of our basic template useful. We would be interested to hear of helpful experiences of using it in practice in solving poverty. As ever, if you have better ideas on how to better focus the poverty fixers, we would love to hear them.
Until then, we thank you for being…
One in a Billion!